

Install Grafana on Ubuntu 16.04
Grafana is an open-source, data visualization and monitoring tool that integrates with complex data from sources like Prometheus, InfluxDB, Graphite, and ElasticSearch. Grafana lets you create alerts, notifications, and ad-hoc filters for your data while also making collaboration with your teammates easier through built-in sharing features.
Install Nginx
# apt-get update
# apt-get install nginx
$ systemctl status nginx
Output
- nginx.service – A high performance web server and a reverse proxy server
Loaded: loaded (/lib/systemd/system/nginx.service; enabled; vendor preset: enabled)
Active: active (running) since Mon 2016-04-18 16:14:00 EDT; 4min 2s ago
Main PID: 12857 (nginx)
CGroup: /system.slice/nginx.service
├─12857 nginx: master process /usr/sbin/nginx -g daemon on; master_process on
└─12858 nginx: worker process
go to browser and browse your server ip to check is nginx running
Installing Grafana
# curl https://packagecloud.io/gpg.key | sudo apt-key add -
# add-apt-repository "deb https://packagecloud.io/grafana/stable/debian/ stretch main"
# apt-get update
# apt-cache policy grafana
Output of apt-cache policy grafana:
grafana:
Installed: (none)
Candidate: 4.6.3
Version table:
4.6.3 500
500 https://packagecloud.io/grafana/stable/debian stretch/main amd64 Packages
…
# apt-get install grafana
# systemctl start grafana-server
# systemctl status grafana-server
Output of grafana-server status:
● grafana-server.service – Grafana instance
Loaded: loaded (/usr/lib/systemd/system/grafana-server.service; disabled; vendor preset: enabled)
Active: active (running) since Tue 2018-02-27 13:13:59 +08; 4s ago
Docs: http://docs.grafana.org
Main PID: 2468 (grafana-server)
Tasks: 6
Memory: 13.4M
CPU: 290ms
CGroup: /system.slice/grafana-server.service
└─2468 /usr/sbin/grafana-server –config=/etc/grafana/grafana.ini –pidfile=/var/run/grafana/grafana-server.pid cfg:
Setting Up the Reverse Proxy
# cp -R /etc/nginx/sites-available/default /etc/nginx/sites-available/default.bak
# vim /etc/nginx/sites-available/default
Locate the following block:
…
location / {
# First attempt to serve request as file, then
# as directory, then fall back to displaying a 404.
try_files $uri $uri/ =404;
}
…
Change the existing block to this:
…
location / {
proxy_pass http://localhost:3000;
proxy_http_version 1.1;
proxy_set_header Upgrade $http_upgrade;
proxy_set_header Connection ‘upgrade’;
proxy_set_header Host $host;
proxy_cache_bypass $http_upgrade;
}
…
Save & quit
# systemctl reload nginx
You can now access the default Grafana login screen by pointing your web browser to server ip.

By default, every Grafana uses the same administrative login credentials, the USER and PASSWORD are admin.
Updating Credentials
Click on the small Grafana logo in the upper,hover over the admin button and click on the profile button
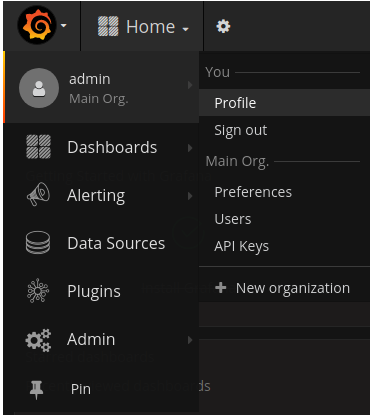
You may edit all your profile settings at here.

Disabling Grafana Registrations and Anonymous Access
vim /etc/grafana/grafana.ini
locate [users]
uncomment “;” infront the allow_sign_up and change “true” to “false” to disable others register on Grafana.
The code should be like this:
…
[users]
# disable user signup / registration
allow_sign_up = false
…
locate [auth.anonymous]
Setting enabled to true gives non-registered users access to your dashboards; setting this option to false limits dashboard access to registered users only.
…
[auth.anonymous]
# enable anonymous access
enabled = false
…
Save and exit.
systemctl restart grafana-server
At this point, Grafana is fully configured and ready for use.


Leave a Reply
Want to join the discussion?Feel free to contribute!